Typical
applications
MASI software can
be applied to these aspects: (1) generation of mapping products (point clouds,
DSM, DTM, orthorectified image, and pansharpened image); (2) automatically finding change of
surface height (used in the automatic finding of new buildings, the unplanned
buildings and the removed buildings, and estimating their corresponding
accurate height); (3) monitoring the construction progress of new city, big
residential district and huge engineering project; (4) testimony of land
expropriation and housing demolition; (5) estimating the exploited volume of
ores located on surface; (6) digital city and reconstruction of 3D scene; (7)
collection of commercial and military intelligence; (8) accurate estimation of
height of buildings and trees.
Cases and Results (The
following items can be accessed by clicking):
Case 1: Generation of highly dense and accurate DSM
Case 4: Results of aerial three-lines-scanner
ADS (ADS40, ADS80, ADS100) images
Case 7: 3D reconstruction with true color textures
Case 8: Mosaicking of hyper-spectral UAV images
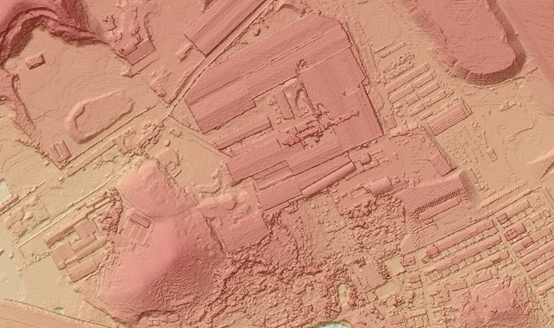
Case 1:
Generation of highly dense and accurate DSM
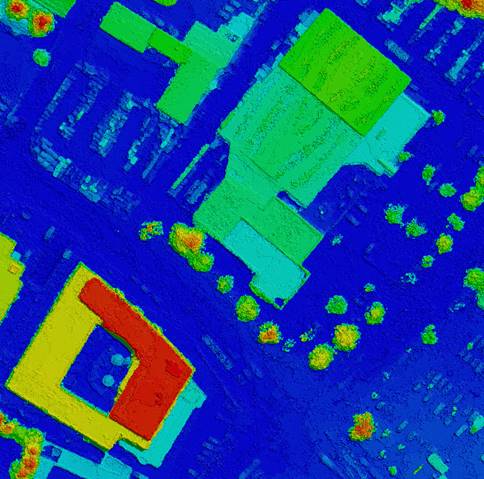
Figure
1.1 Color-shaded DSM extracted from DMC images, grid size: 10 cm
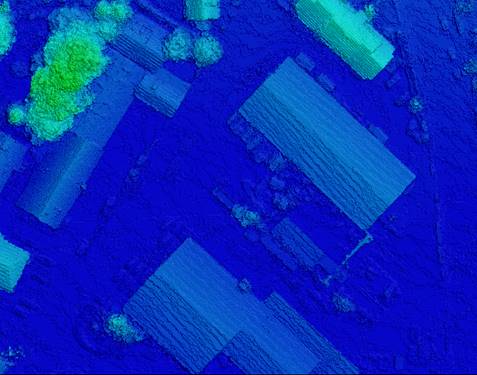
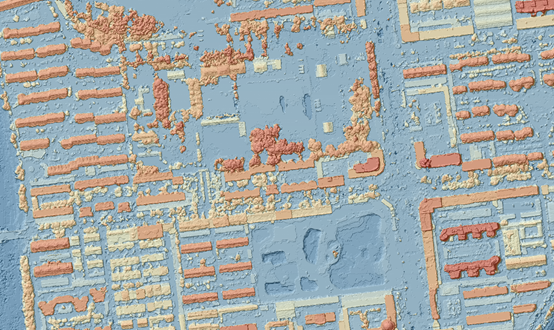
Figure
1.2 DSM extracted from frame aerial images, grid size: 10 cm
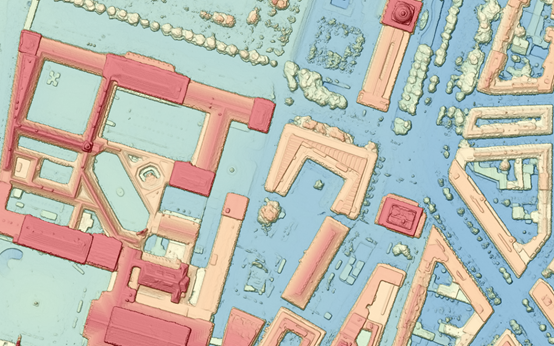
Figure
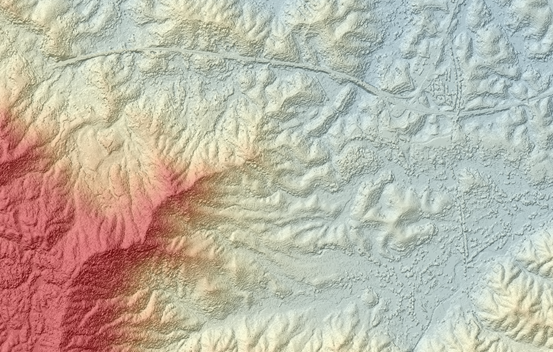
1.3 DSM extracted from Pléiades NEO satellite images,
grid size: 50 cm
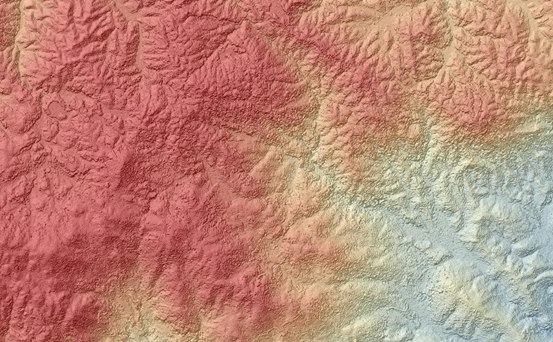
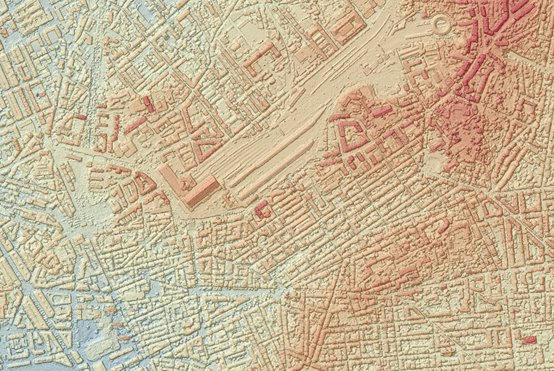
Figure
1.4 DSM extracted from Gaofen-7 (GF-7) satellite images, grid size: 1 m
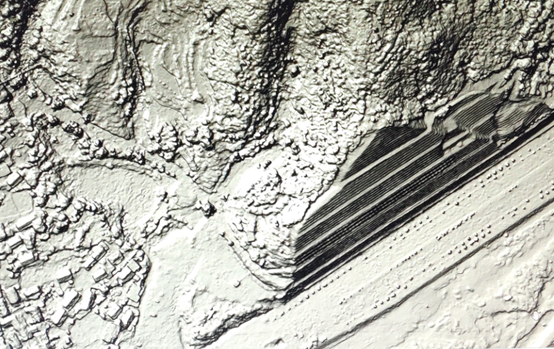
Figure
1.5 DSM extracted from aerial ADS80 (three lines scanner) images, grid size: 20
cm
Figure
1.6 DSM extracted from UAV images, grid size: 20 cm
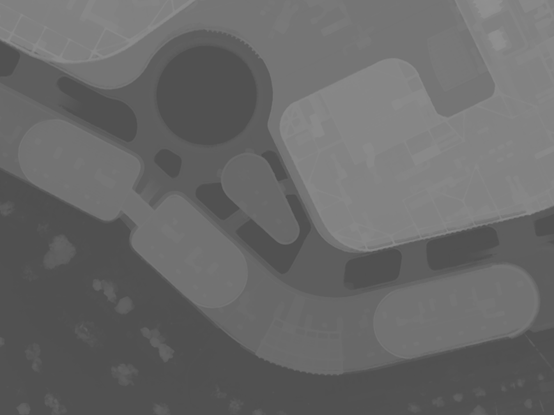
Figure
1.7 DSM extracted from UAV images (vegetation in roundabout), grid size: 5 cm
Case 2: Volume
calculation
Given a polygon
in the vector form, a height of base plane (or DSM of previous phase) and
highly dense DSM, the function estimates the volume of objects (e.g., sands,
small stones, coal, mineral particles and garbage) occupying the base plane (or
the surface of previous phase).
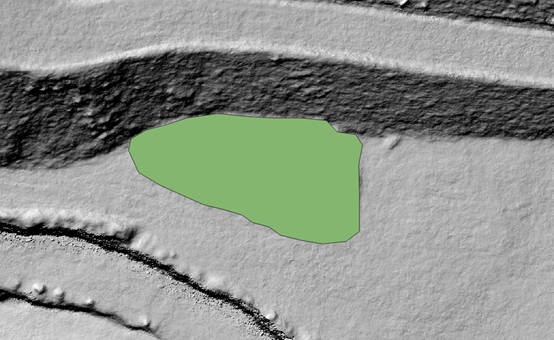
In this case,
the area of the depicted
boundary is 1106.00 m^2, while the volume is 3659.30 m^3.
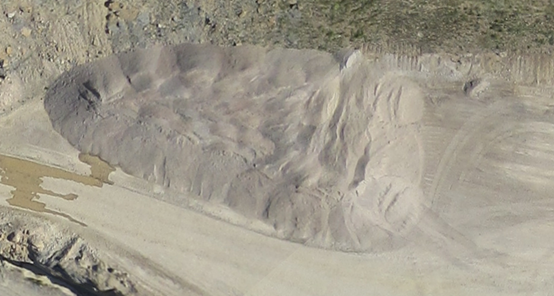
Figure
2.1 The ortho-image automatically
generated from UAV images, resolution: 5 cm
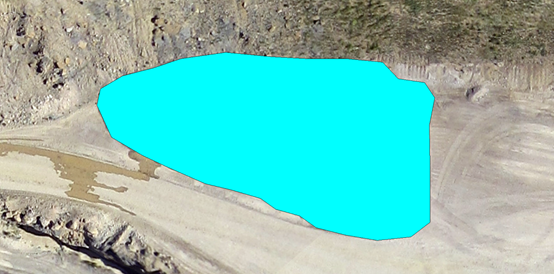
Figure
2.2 The boundary to be used to calculate volume
depicted on the above ortho-image
Figure
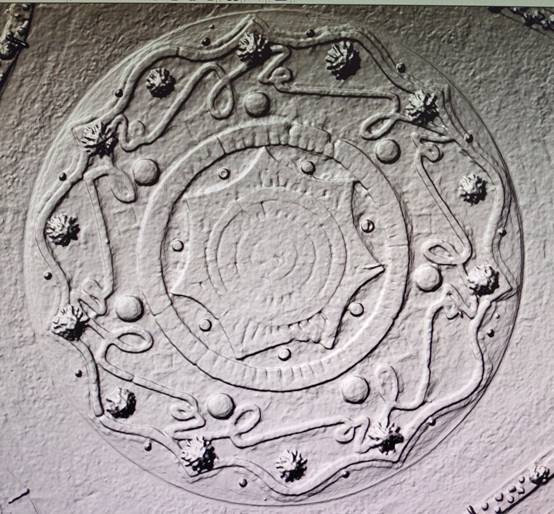
2.3 The highly dense and accurate DSM to be used to
calculate volume (hill shaded DSM), grid size: 5 cm
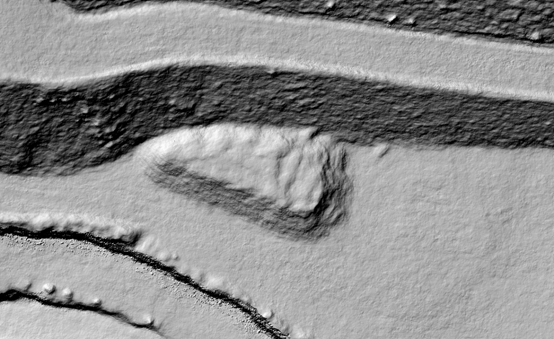
Figure
2.4 Overlapping displaying of the depicted boundary and the above DSM
Case 3: Extraction of building attributes (the
center position of building, height of building, number of layers, area of
ground, and construction area of building)
The function can
be used in the automatic finding of new buildings, the unplanned buildings and
the removed buildings, and estimating their corresponding accurate height, in monitoring
the construction progress, in automatic finding of tall objects above a height
in airport area, and in the extraction of building height.
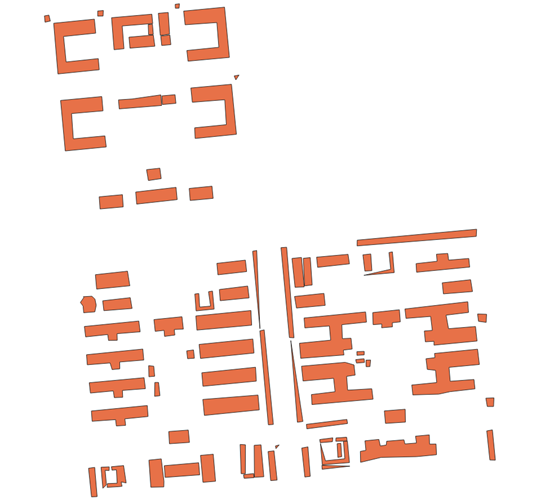
Figure
3.1 The building footprints collected on the height difference
between two DSMs as input (building footprints can also be from third party
source)
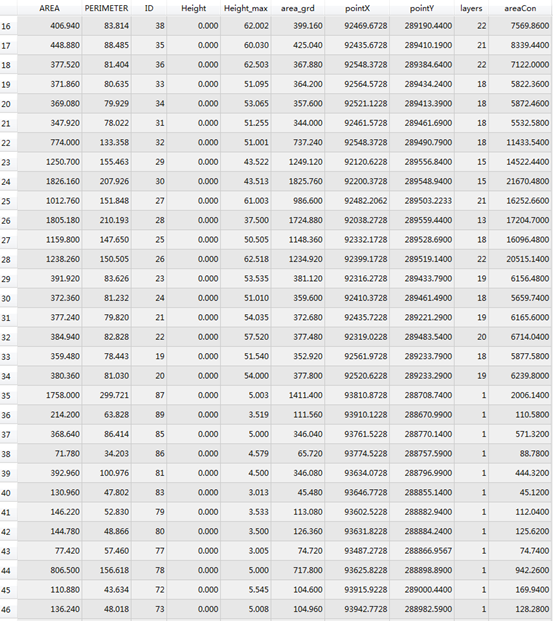
Figure
3.2 Given a vector file with ERSI shape format shown in figure 3.1, which
including multiple polygons of building footprint, and the corresponding nDSM dataset (i.e., the height difference, which can be
generated from the module “Surface Change” in the main interface), it automatically
extracts the center position (x, y coordinates) of building, area of ground, height
of building, number of layers, and construction area of building for each
building. Moreover, these extracted values are set as new attributes for these
polygons.
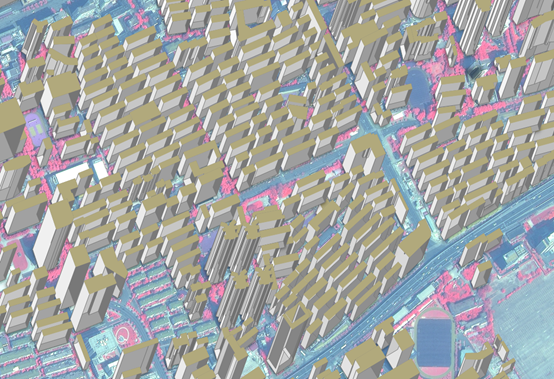
Figure
3.3 The building attributes (the center position of building, height of
building, number of layers, area of ground, and construction area of building) automatically
extracted from SuperView-1 stereo images. Building footprints can be from third
party source or be collected by using MASI software. These extracted attributes
are automatically added to the vector file. The buildings are visualized via
GIS platform in the figure.
Case 4: Results
of aerial three-lines-scanner ADS (ADS40, ADS80, ADS100) images
Figure
4.1 Pixel-wise DSM extracted from aerial ADS images, grid size: 20 cm

Figure
4.2 Pixel-wise DSM extracted from aerial ADS images, grid size: 20 cm
Figure
4.3 Pixel-wise DSM extracted from aerial ADS images, grid size: 20 cm
Case 5: Results of UAV images
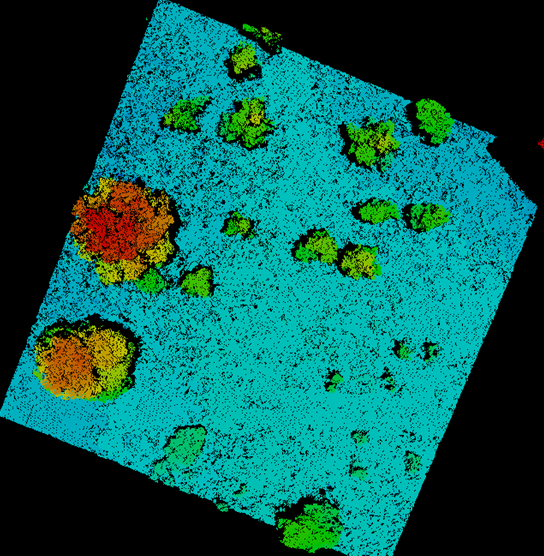
Figure
5.1 The generated point clouds, trees, grid size: 5 cm
Figure
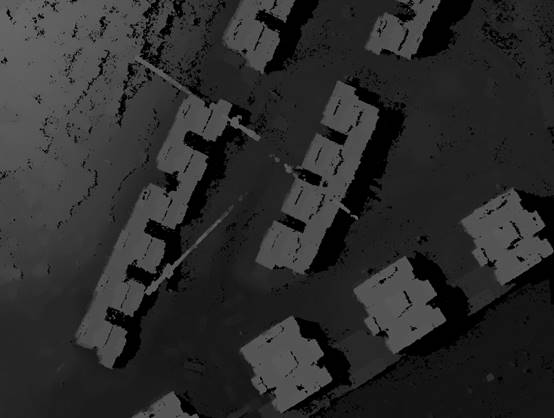
5.2 The highly dense and accurate DSM generated, top
of building, grid size: 5 cm
Figure
5.3 The generated DSM before interpolation, the
buildings under construction and cranes, grid size: 20 cm
Figure
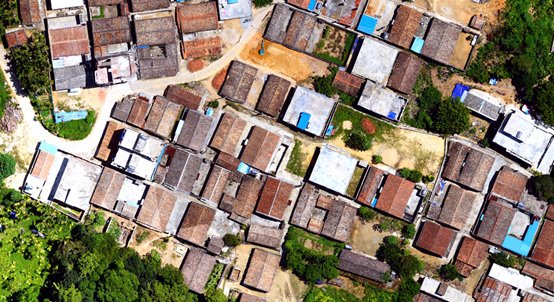
5.4 The true ortho-mosaicked
image automatically generated from UAV images (flowchart: the generation of
highly dense DSM -> ortho rectification using the
DSM -> mosaicking). For the sake of showing the seaming effect, the adjacent
images with color difference are selected.
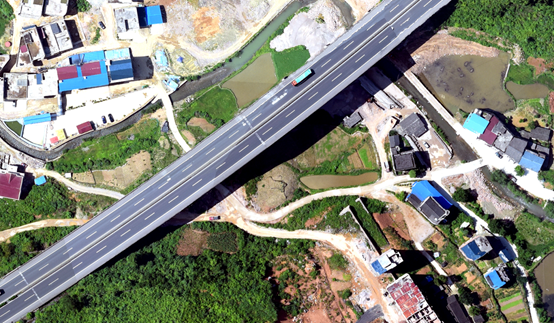
Figure
5.5 The true ortho-mosaicked
image automatically generated from UAV images (flowchart: the generation of
highly dense DSM -> ortho rectification using the
DSM -> mosaicking). For the sake of showing the seaming effect, the adjacent
images with color difference are selected.
Case 6: Automatic
DSM to DTM
DSM
DTM
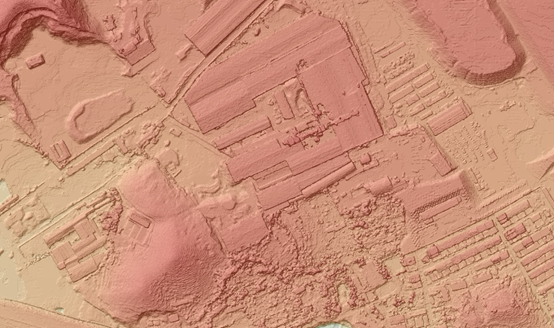
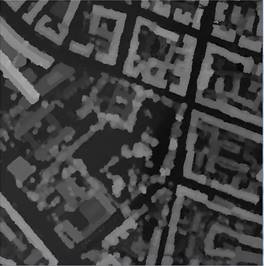
Figure 6.1 DTM transformed from DSM extracted from satellite image with
1 meter grid size
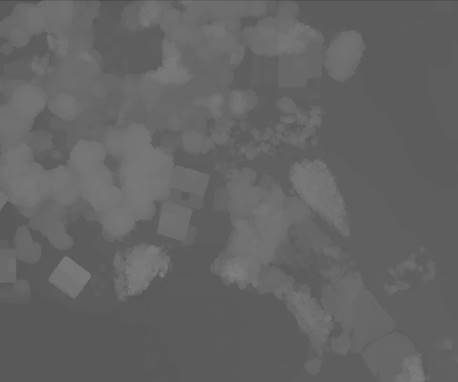
(a) DSM

(b) DTM
Figure 6.2 (a) DSM extracted from SWDC-4 aerial images by MASI
software, grid size: 20 cm; (b) DTM transformed from DSM, grid size: 20 cm
Case 7: 3D reconstruction
with true color textures
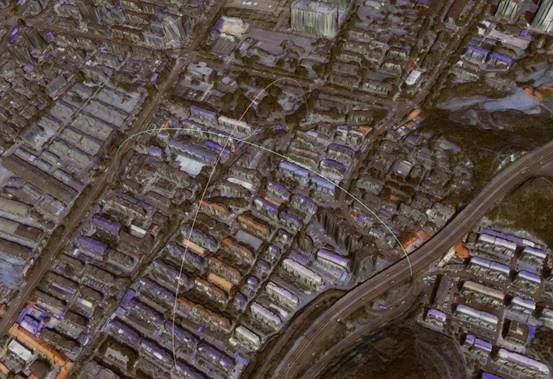
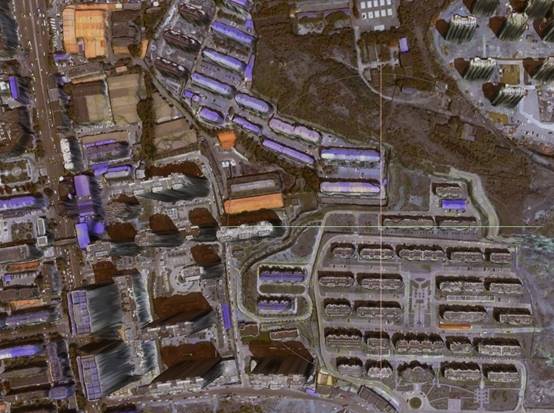

Figure 7.1 3D TIN models with true color textures. The above three
figures are generated from Pléiades 70 cm triplet
images.
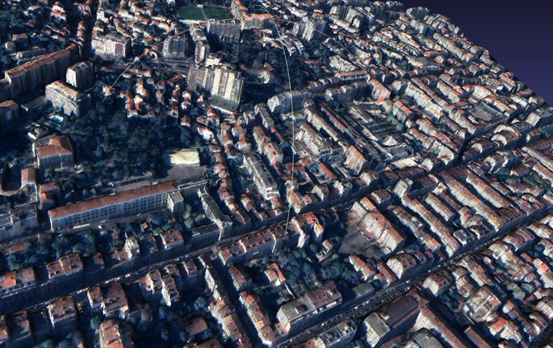
Figure 7.2 3D TIN models with true color textures. The figure is
generated from Pléiades NEO 30 cm triplet images.
Case 8:
Mosaicking of hyper-spectral UAV images
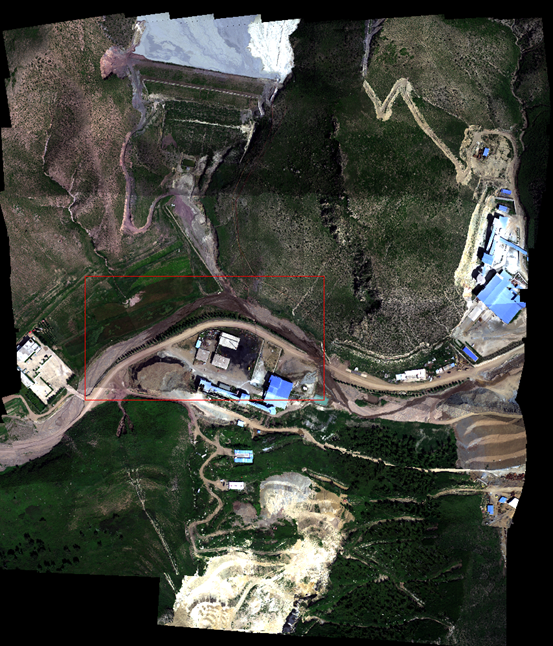
Figure 8.1 The mosaicked results of hyper-spectral
UAV images, 176 bands, the ground slope is high.